Most of the time, we use alternate row color on table control to make it more easy readable for the end user. But we get stuck and make it tricky if we have to use alternate ROW/COLUMN color in MATRIX. Let’s see how we can achieve
If you want, you can download a sample report from here before moving down. Because I have used fields/group names in below steps explanation and it will help you to understand the steps quickly.
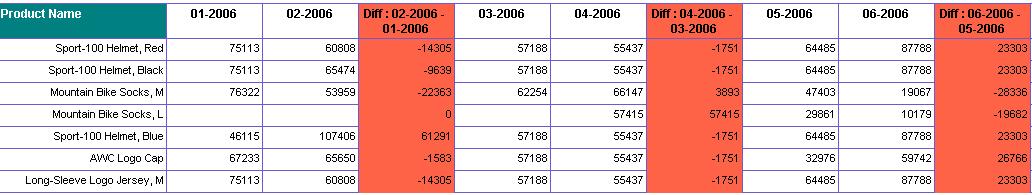
Alternate Column color in Matrix
 |
| Image1 |
To achieve this, we need to follow following steps. For this section, refer Matrix_Alternate_Column_Color control in the sample report.
1. Add a fake parent column group in your matrix
under Column Groups section and give any value to
Group expression (refer Image1 regarding this step).
2. Select cell/textbox of the matrix column group on which you want to set the alternate background color and open the property window by pressing F4 key.
3. Under the BackgroundColor property, use this expression (change the color name as per your need)
=IIF(RunningValue( Fields!OrderDate_MonthYear.Value, countDistinct, "FakeParentColumnGroupForRowNumber" ) MOD 2, "Maroon", "DarkBlue")
Here you need to change the Fields!OrderDate_MonthYear.Value with your filed name that you are using in the column group expression as a topmost subsequent child group.
In the sample, I am using Fields!OrderDate_MonthYear.Value as a field because my ChildColumnGroup expression is on this field.
Now you are done with this section. Preview your report and check it out.
Alternate Row color in Matrix
To achieve this, we need to follow following steps. For this section, refer Matrix_Alternate_Row_Color control in the sample report.
1. Right click on your left most column of the matrix and insert/add a new column by choosing option Inside Group – Left. You can say this column as a fake column.
2. Now give an appropriate textbox name to this newly added fake column’s cell/textbox that appears in row group. I am using txtRowNumber as textbox name in the sample report and put this expression under that textbox
=RunningValue(Fields!Product_Id.Value,countDistinct,Nothing)
Here you need to change the Fields!Product_ID.Value with your filed name that you are using in the Row Group expression. In sample, my Row Group expression is on Fields!Product_ID.Value
3. Now select cell(s)/textbox(s) of the matrix row on which you want to set the alternate background color and open the property window by pressing F4 key.
4. Under the BackgroundColor property, use this expression (change the color name as per your need) =IIF(VAL(ReportItems!txtRowNumber.Value) MOD 2,"Teal","White")
5. Since we are using first column as a fake column, we can hide it in the output. So, let’s set the cell/textbox visibility of this column as false and also you can minimize the width of this column as much as you want.
Now you are done with this section. Preview your report and check it out.
Alternate Row color in Table
To achieve this, we need to follow following steps. For this section, refer Table_Alternate_Row_Color control in the sample report.
1. Select cell/textbox of the table row on which you want to set the alternate background color and open the property window by pressing F4 key.
2. Under the BackgroundColor property, use this expression (change the color name as per your need) =IIF(RowNumber(Nothing) mod 2,"Silver","Transparent")
Here in the expression, I am using Nothing for scope name. Because I am using RowNumber() method on detail level group. If you are using this expression on any Row Group, then you need to specify the name of that group as a scope name inside the RowNumber(<Scope Name>) method.
You need to only change the datasource of the sample report.